Samples of transmission opportunities (txops) on Orange 4G commercial network
These txops files allow to emulate the behaviors of one base station deployed in Orange 4G network, in France. Each line of the txops file represents a time (in ms) where the base station can transmit (in uplink or downlink) an MTU-sized packet.
Measurements of txops on Orange 4G network:
Measurements conditions:
The measurements were performed on Orange 4G network in January 2022 in France, and each capture lasts approximatively 10 minutes. We choosed different network conditions based on categorization inspired by the ARCEP one on their results on measurements campaigns on the quality of mobile services on 2021 Qualité des services mobiles | Arcep. We go beyond and use a finer categorization of cellular network conditions under 5 static configurations based on the average downlink throughput. We also perform measurement inside a car traveling at the steady speed of 110km/h on a highway (between Guingamp and Lannion, in France) to capture the txops in mobility conditions. The table below summarizes the measurements conditions.
| Conditions | Average downlink throughput (Mbps) | Location | Hour |
|---|---|---|---|
| Trace E | 220 | Orange Lannion | 2pm |
| Trace D | 160 | Orange Lannion | 11am |
| Trace C | 120 | Lannion (Brélévenez) | 9am |
| Trace B | 80 | Lannion (Brélévenez) | 1pm |
| Trace A | 40 | Plemeur Bodou | 3pm |
| Highway | 45 | Guingamp – Lannion | 10am |
Usage:
The Mahimahi Linkshell tool can be installed from Mahimahi. It is works on Ubuntu 14.04 and later and can be used with command line. It takes as main arguments the uplink txops file and the downlink txops file. Some optional arguments can be specified such as the type of up/downlink queue.


Experiment protocol
Based on the saturatr tool, the experiment to generate the txops files, consists in capturing network traces samples by saturating link radio of a User Equipment (UE) and the base station. Our testbed is constituted of 02 UE (Smartphone Xiaomi MI M2007J3SY 5G), a Linux Laptop (Ubuntu 20.04) and a Linux Server (Ubuntu 18.04). A UE, USB-tethered to the laptop is used for saturation in both directions. The other UE, Wi-Fi-tethered to the laptop, is used for sending and receiving Acks. This latter is not saturated. During traces captures, each time the UE sends data to the server, it inserts its timestamp in the packets and when it receives the Ack associated to the packets it can compute the RTT. This RTT value is used to adjust the client congestion window according to the following rules:
The same process is applied on the server-side, so that it can modify its congestion window accordingly and hence saturate the link radio of the base station. The description of the functioning of our measurement tool can be summarized in the figure below:
After capturing traces, we can generate a Mahimahi txops file, that will be used by Mahimahi tool, Link Shell, to emulate time varying cellular conditions, by scheduling packet transmissions at an interface at a given network condition, based on the transmission opportunities file that were generated at this condition.
Characterization of the txops files
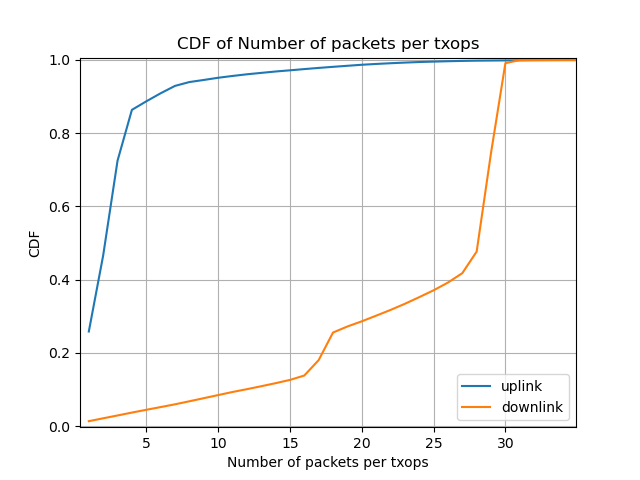
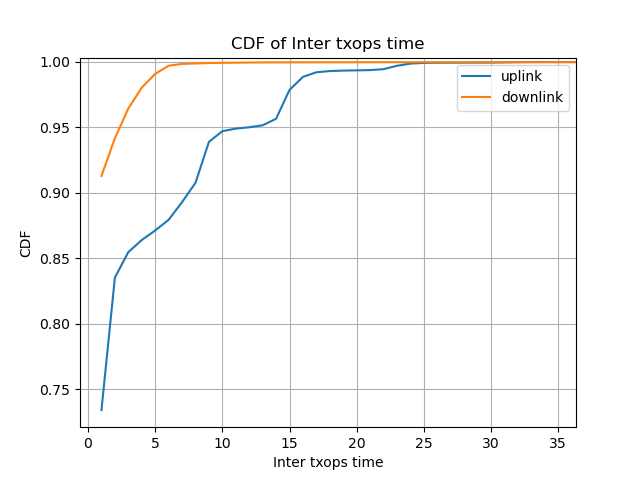
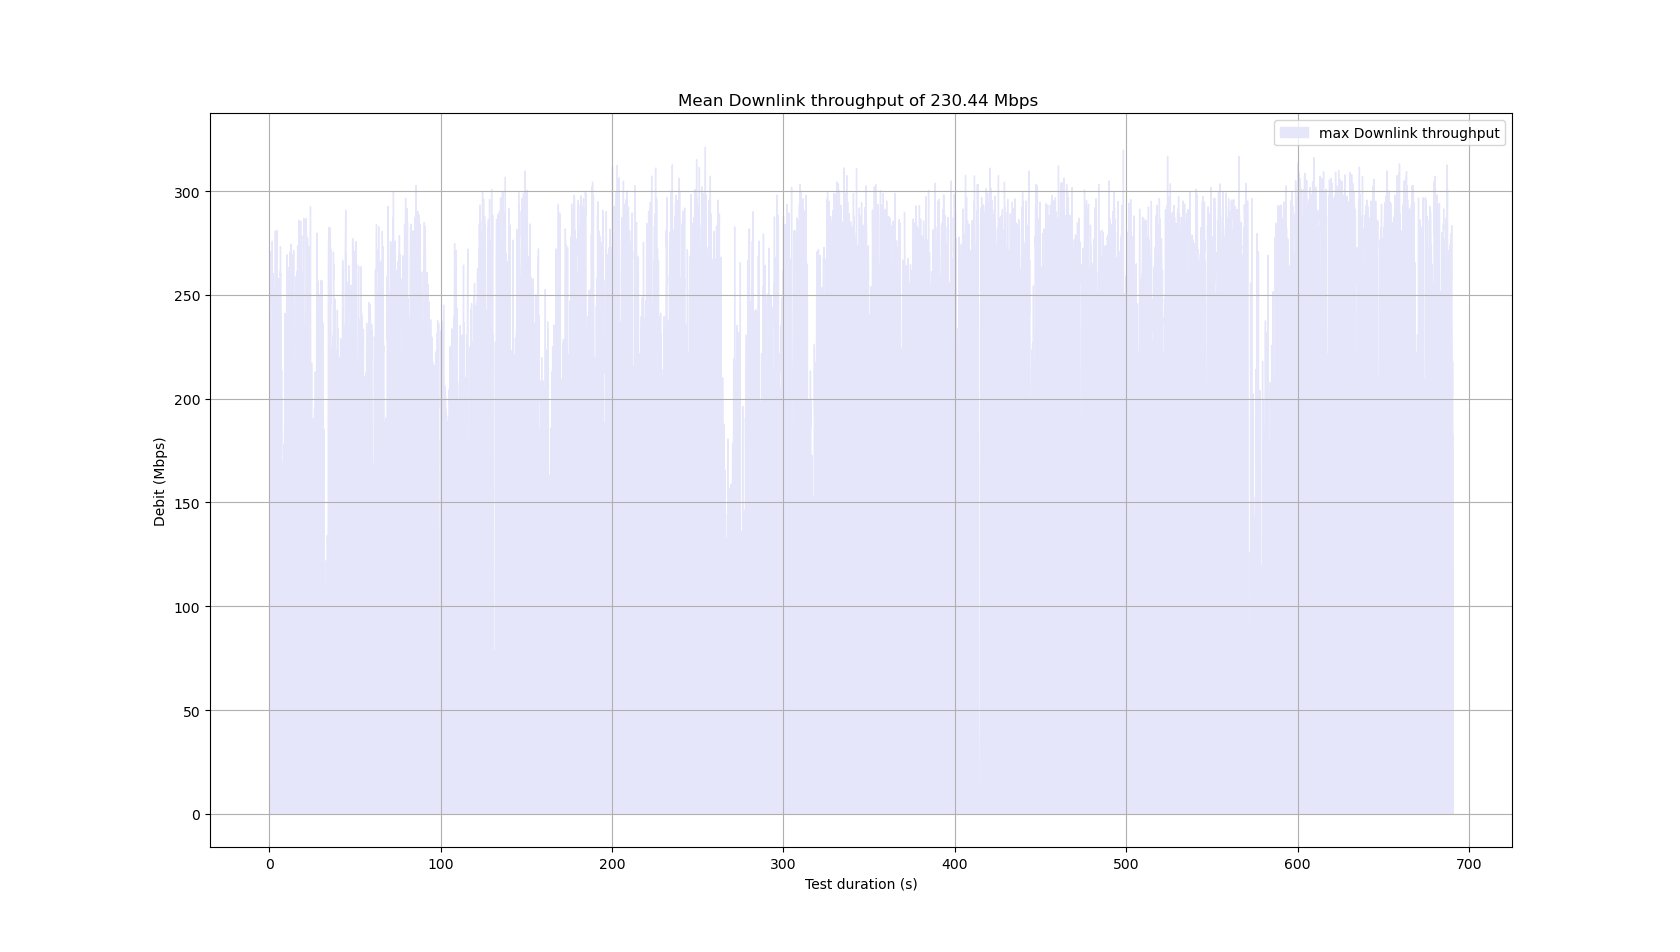
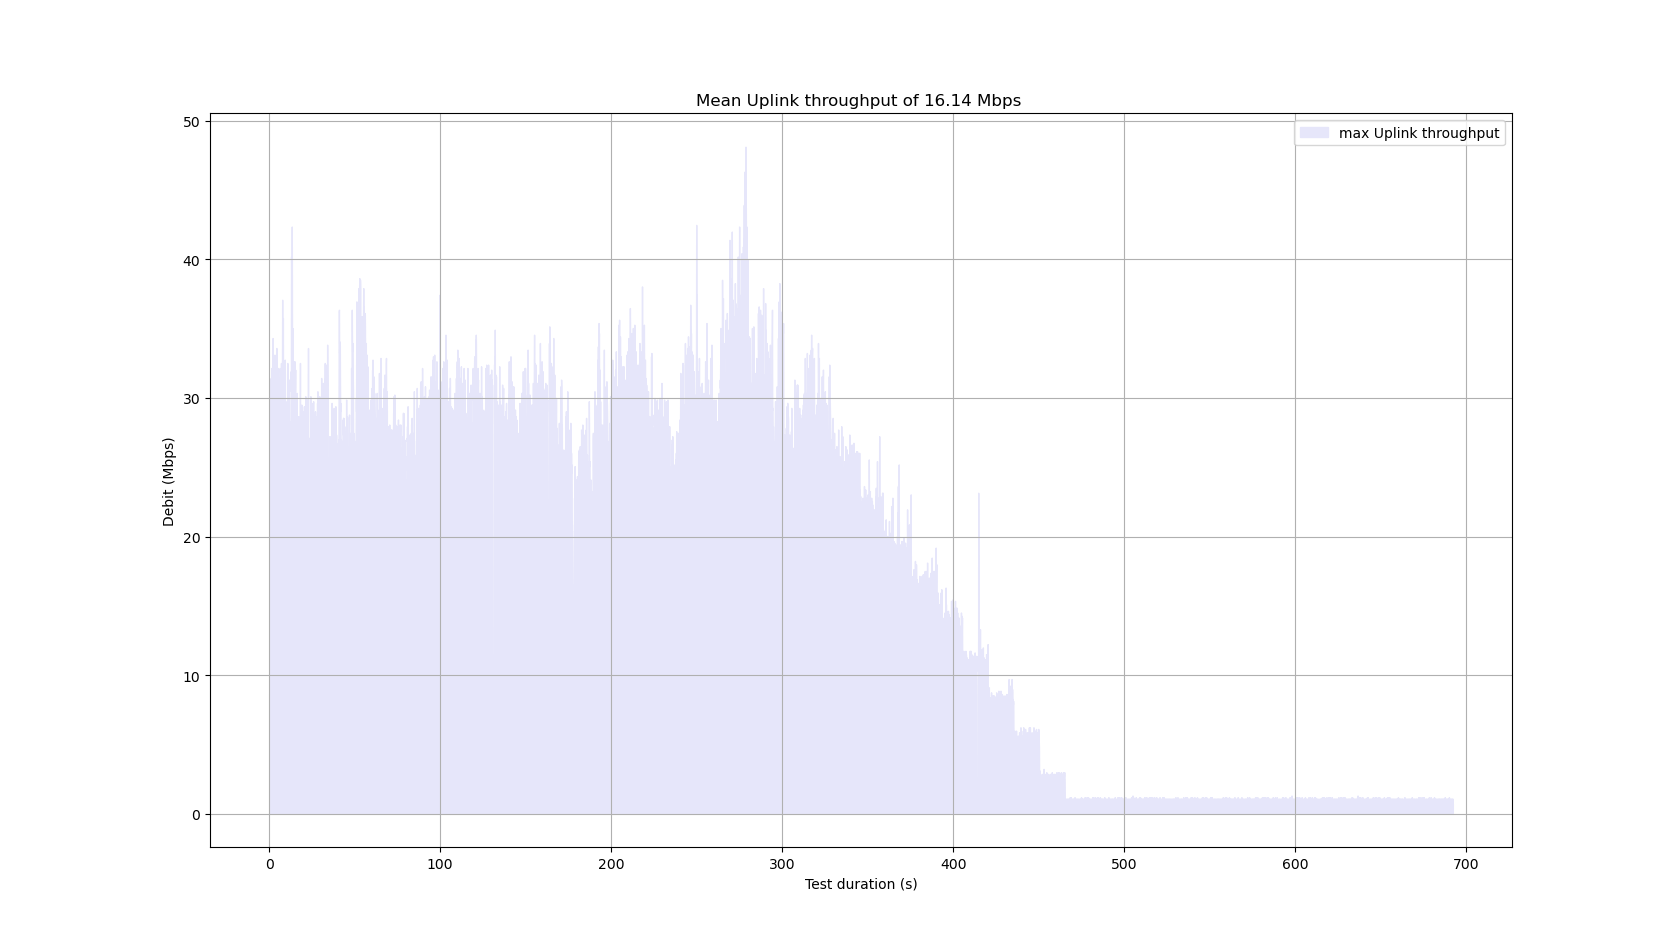
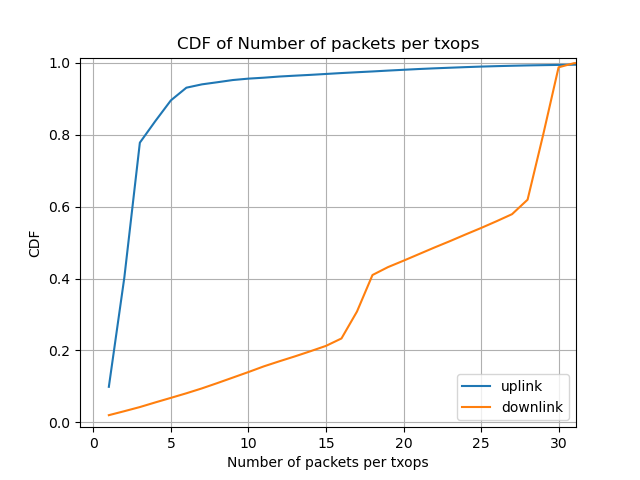
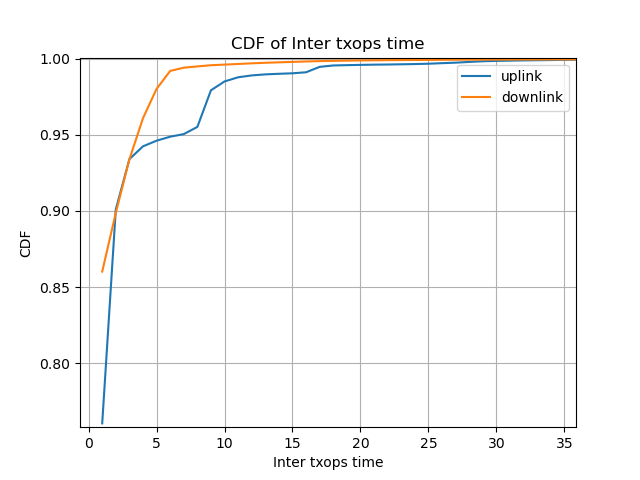
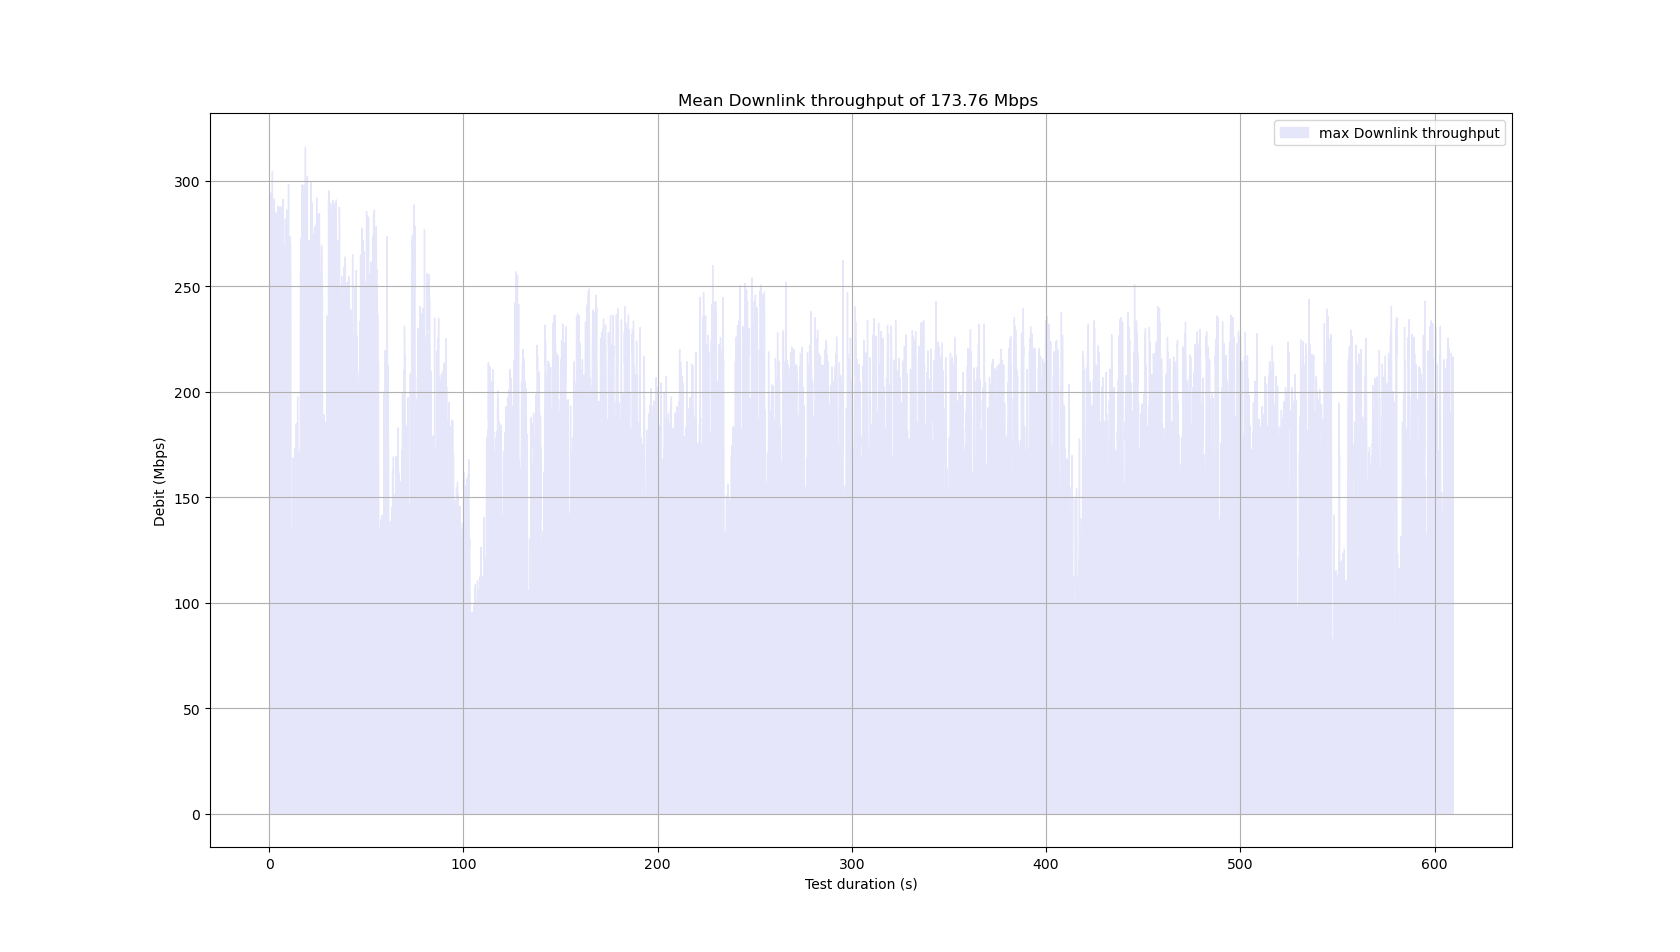
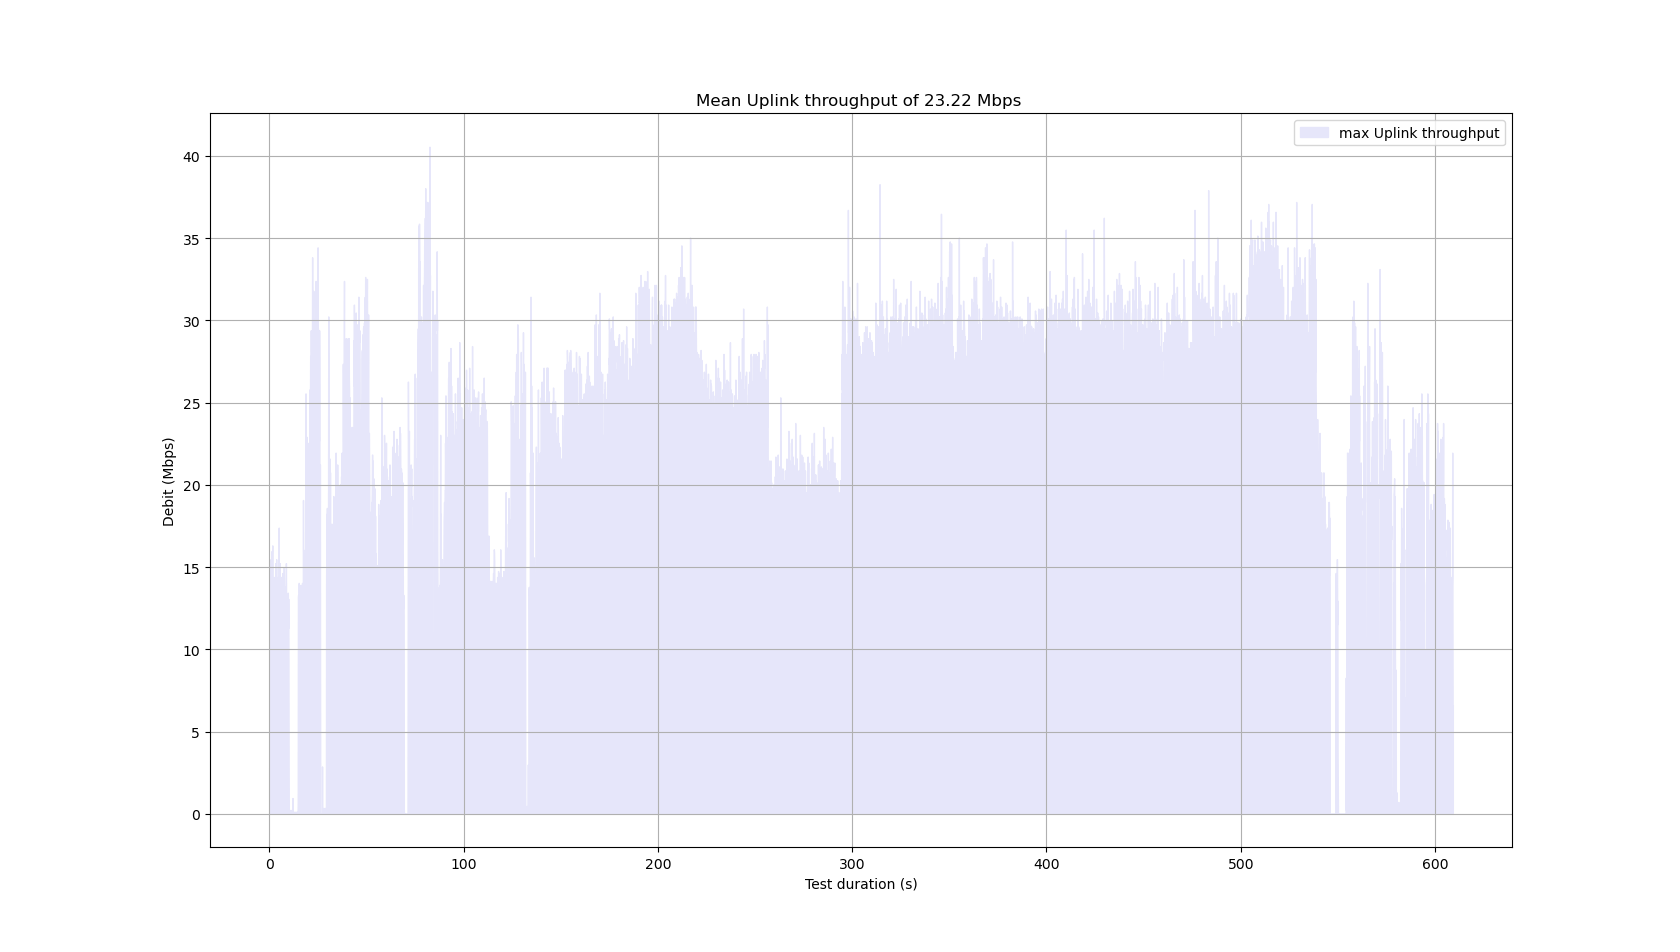
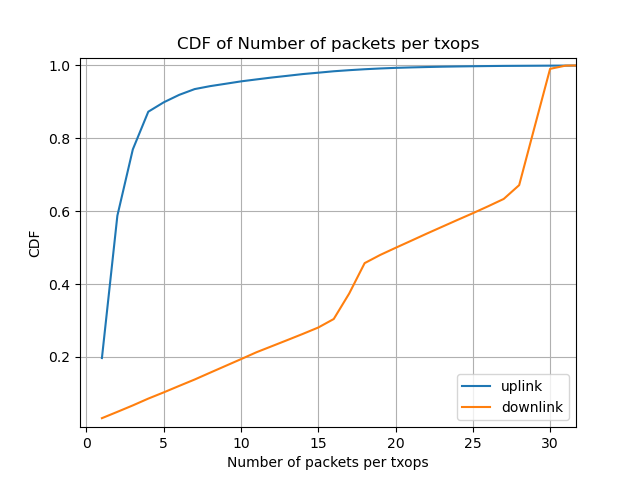
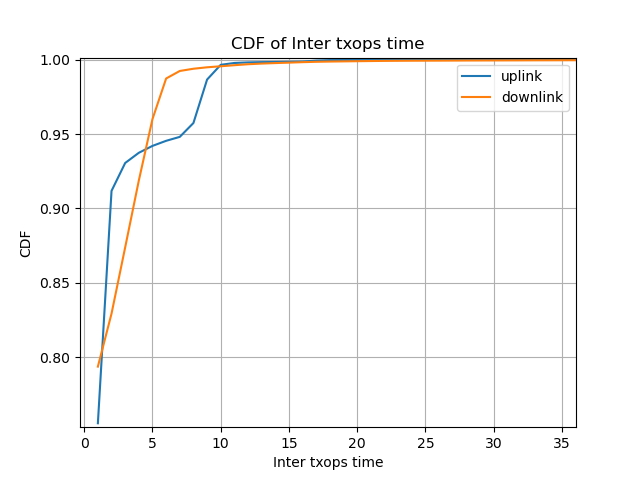
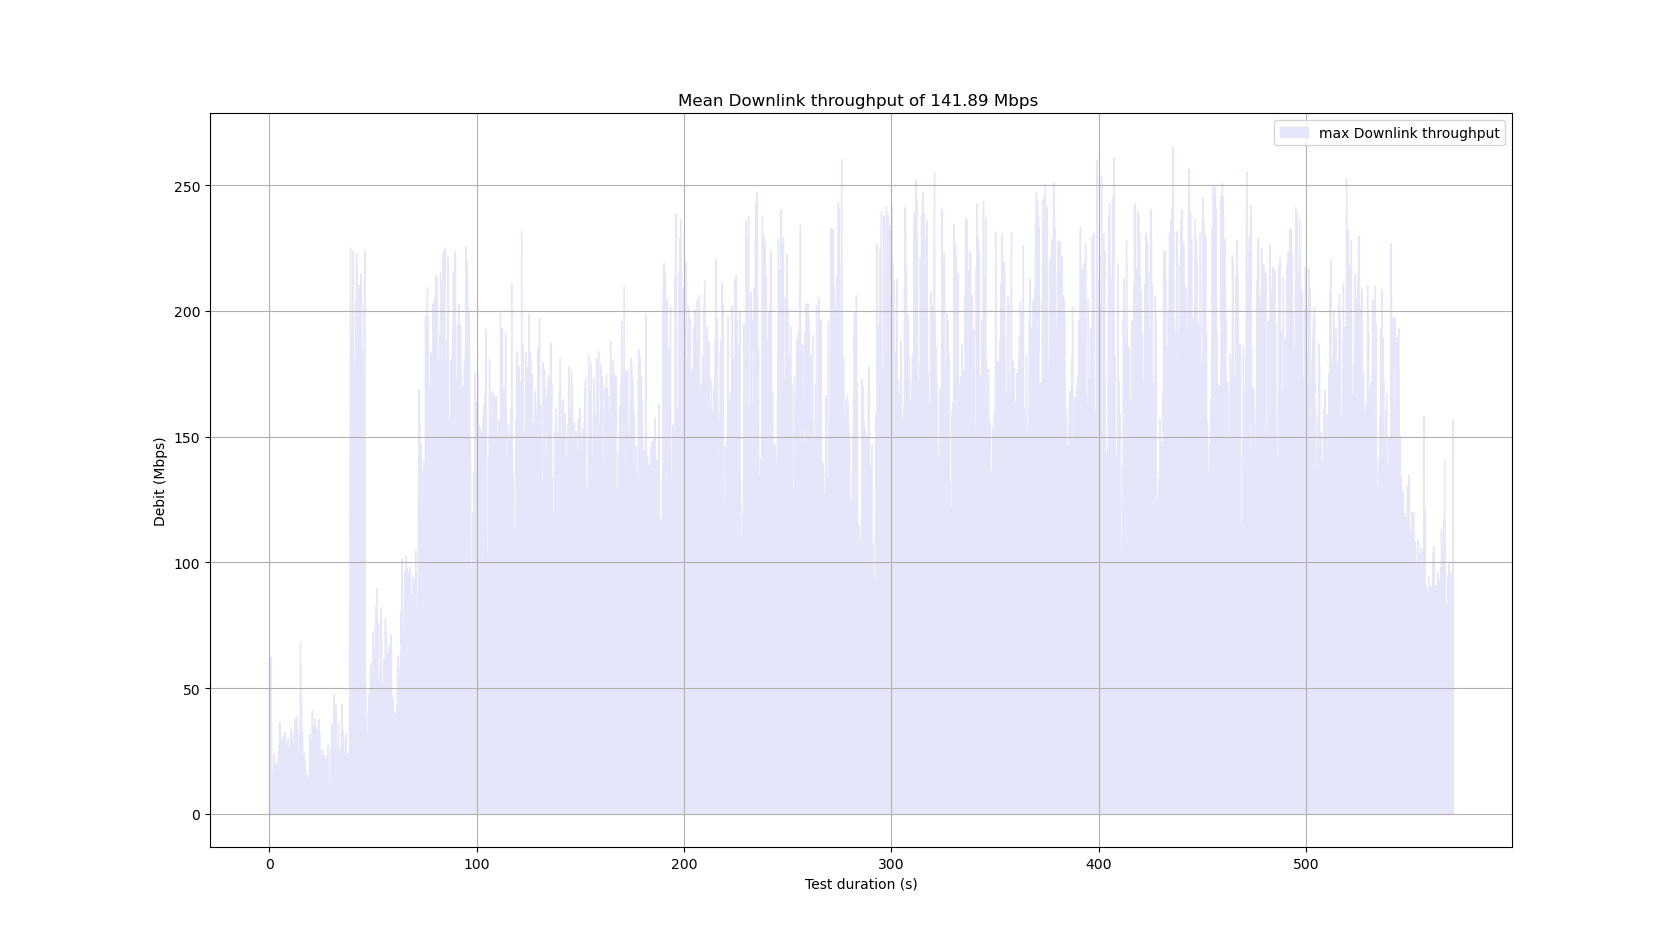
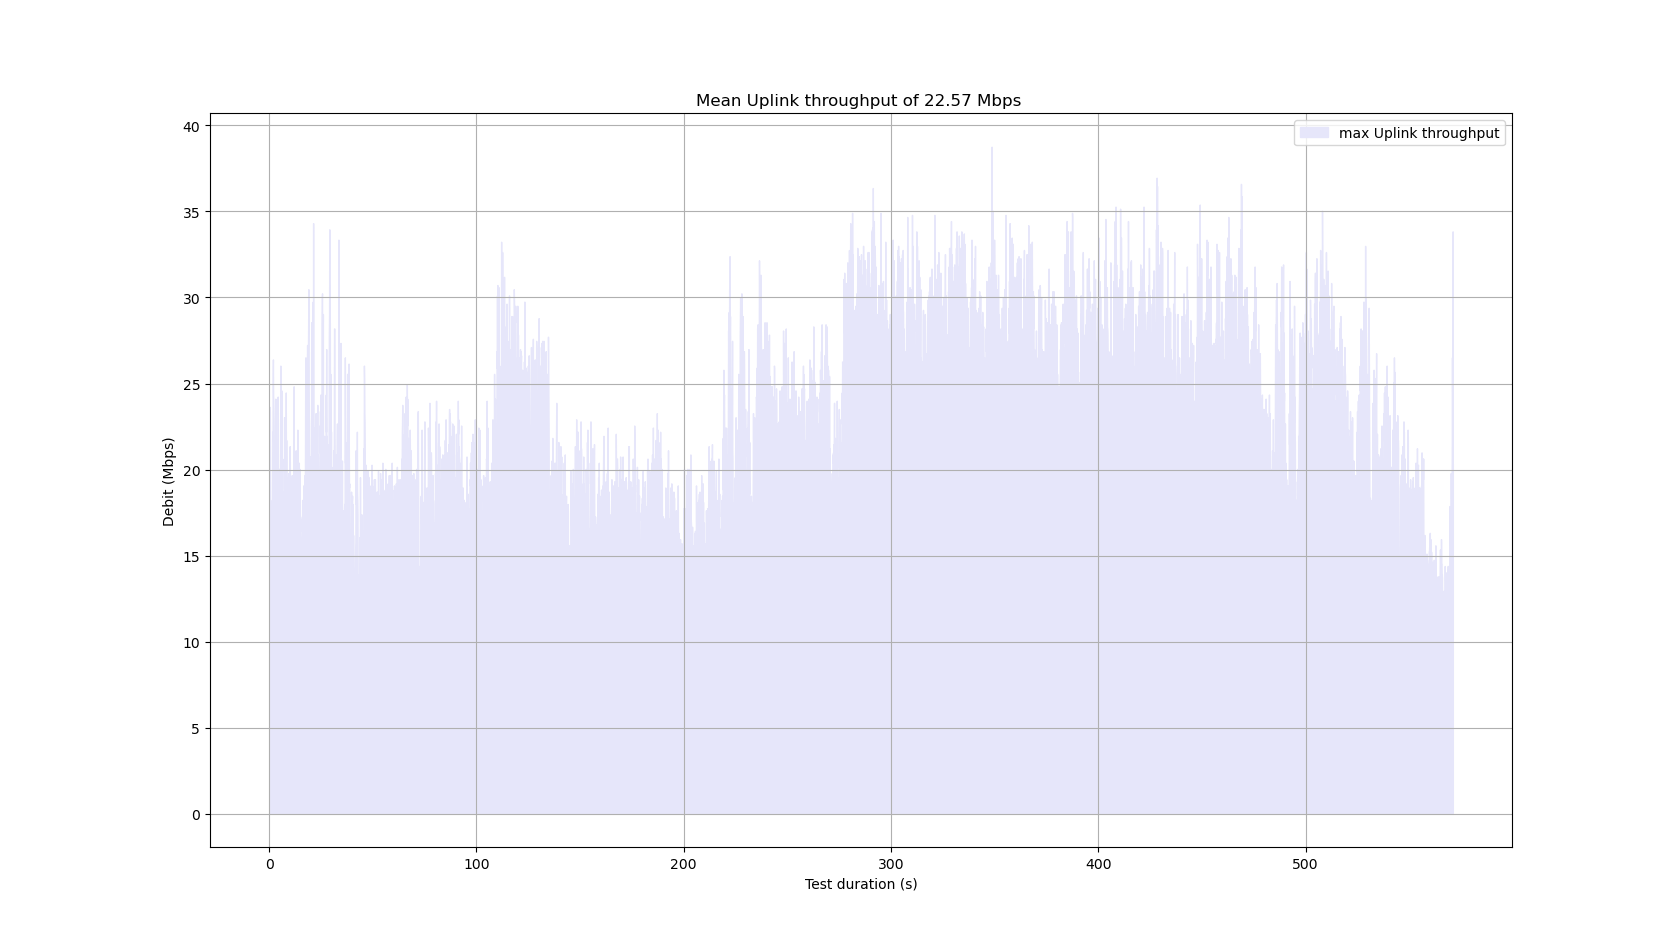
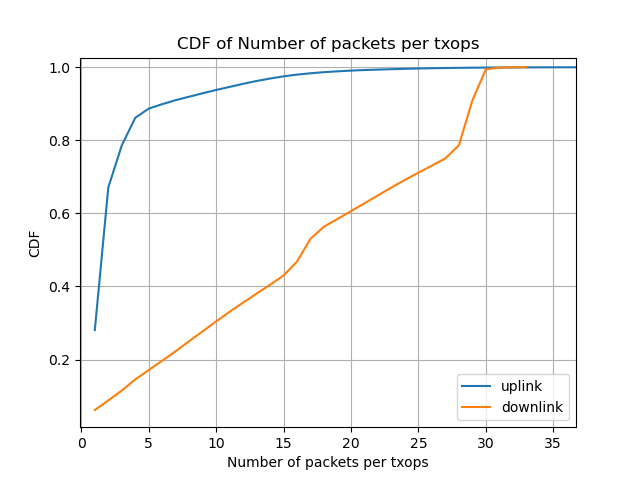
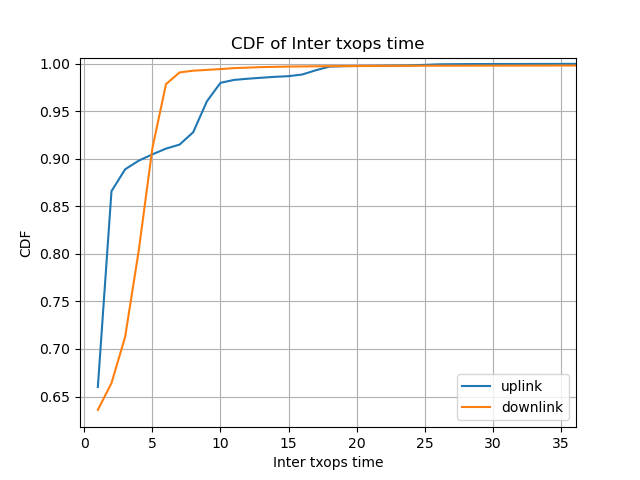
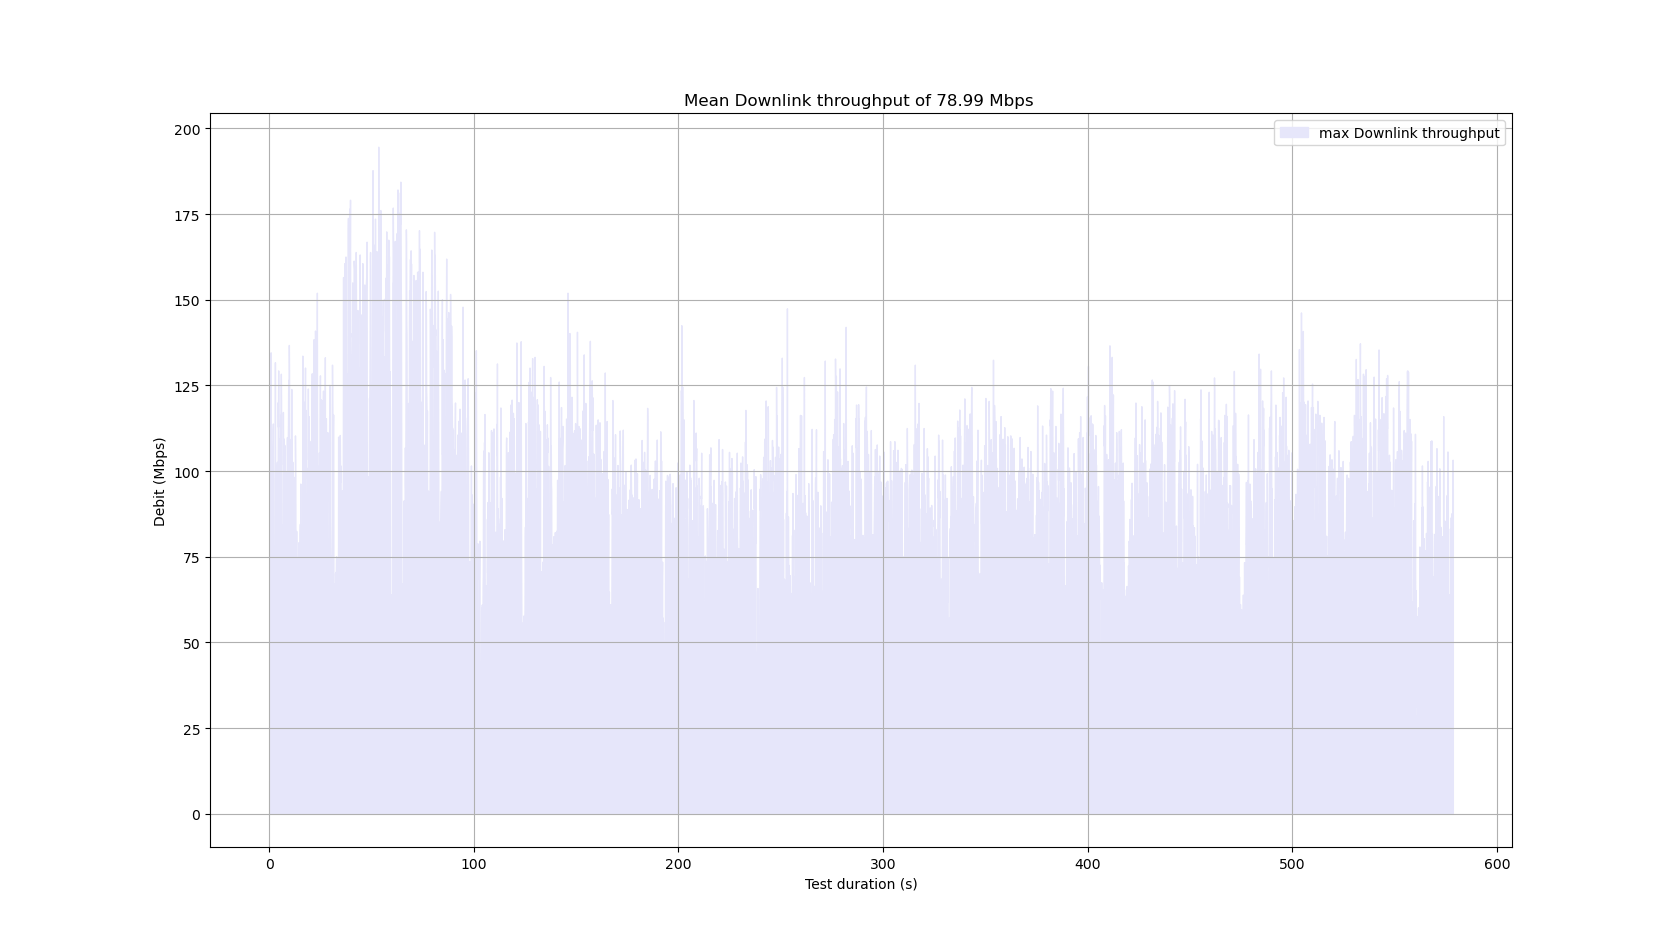
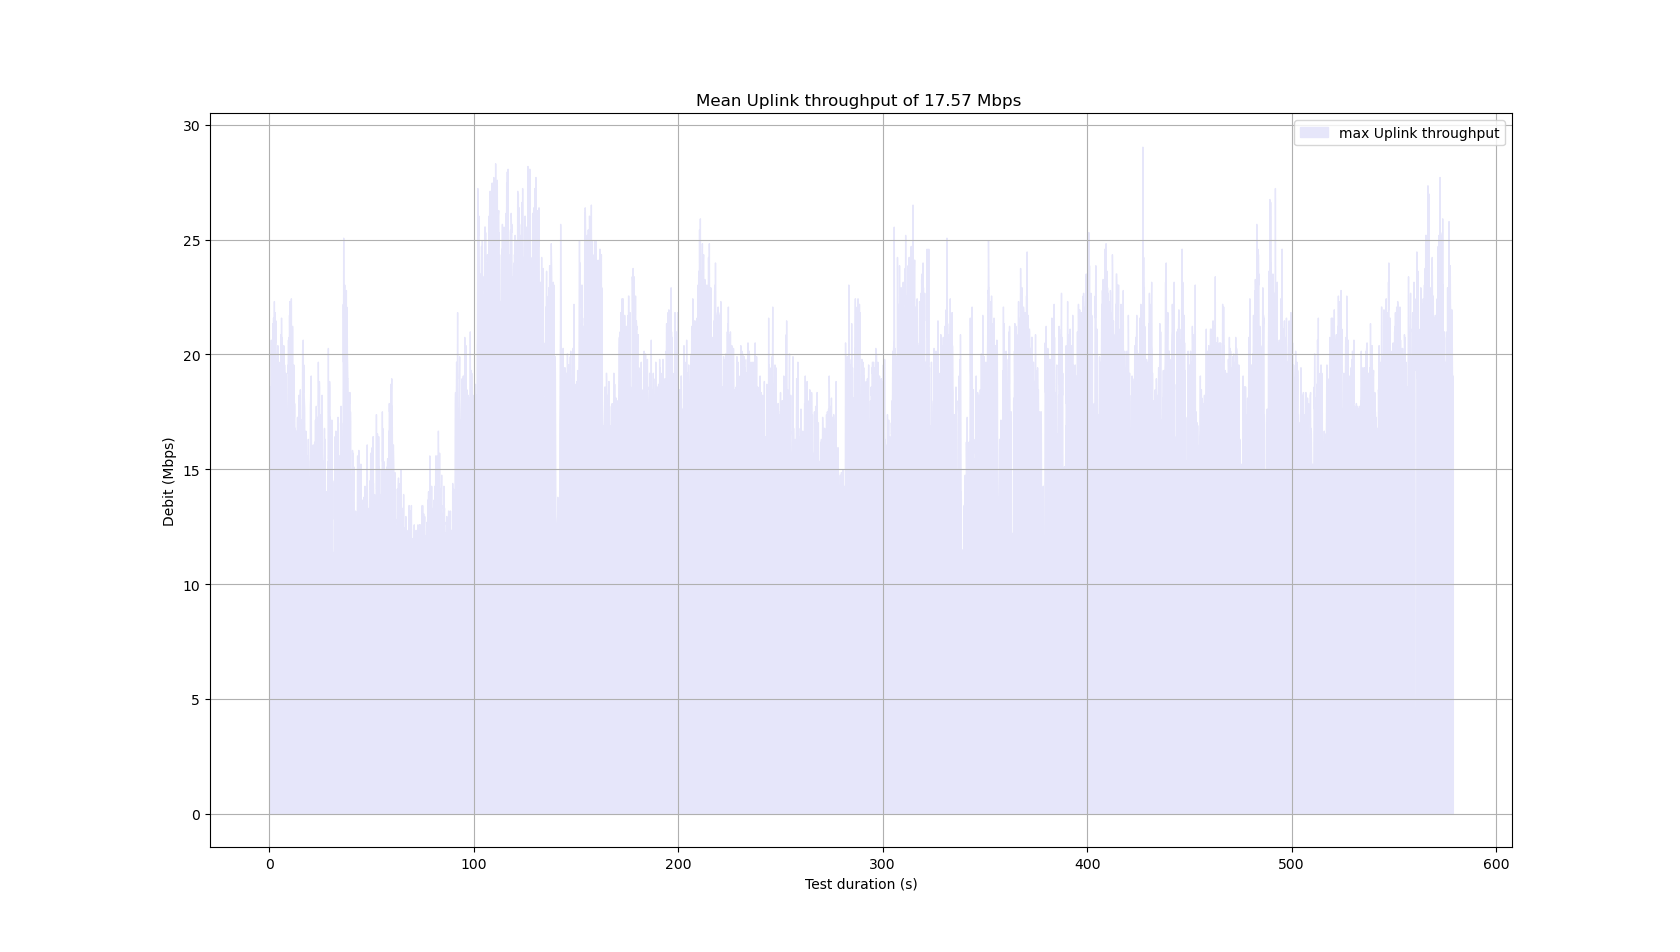
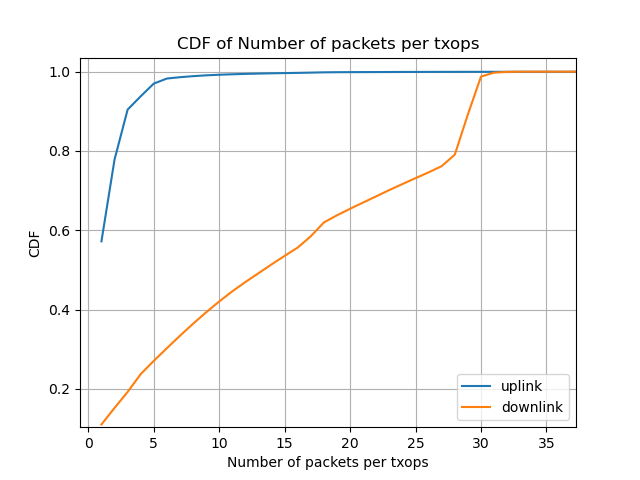
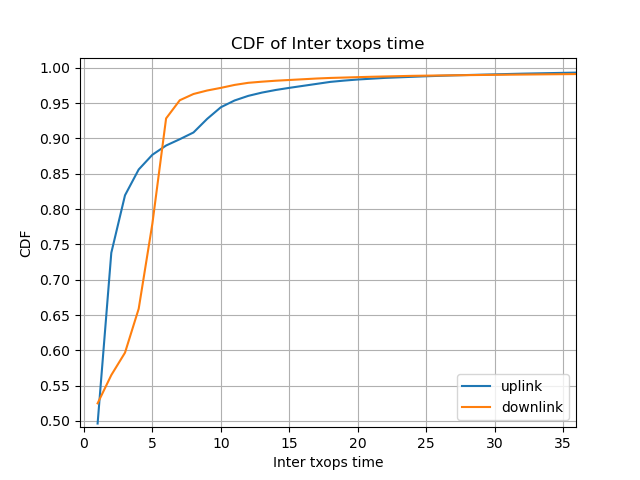
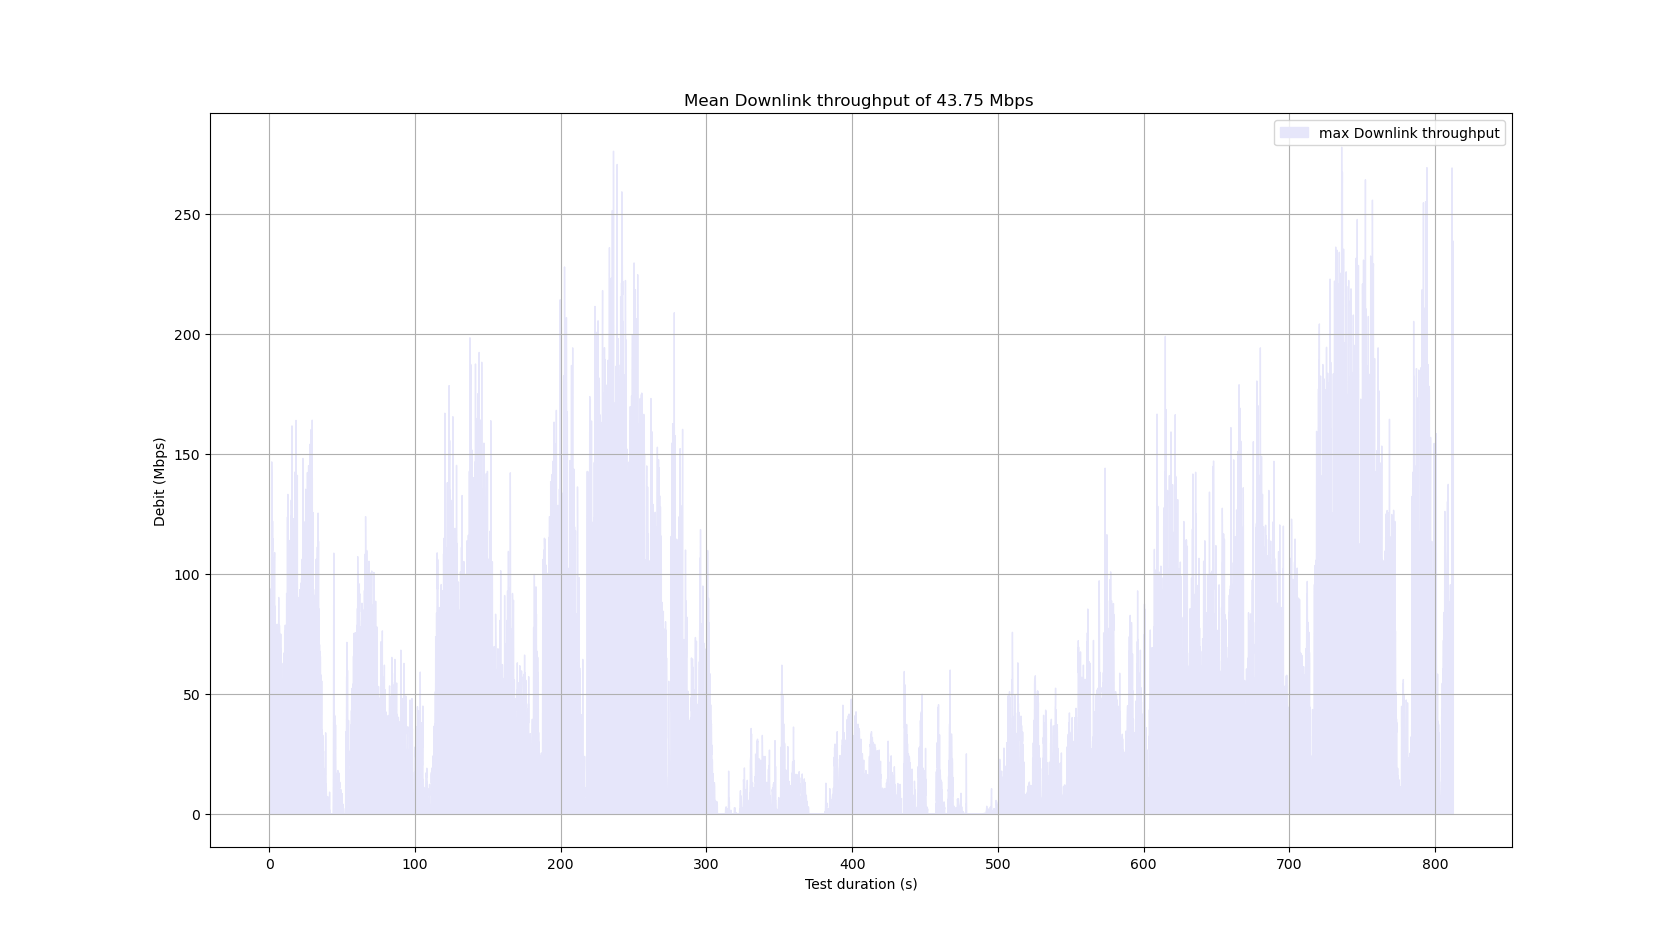
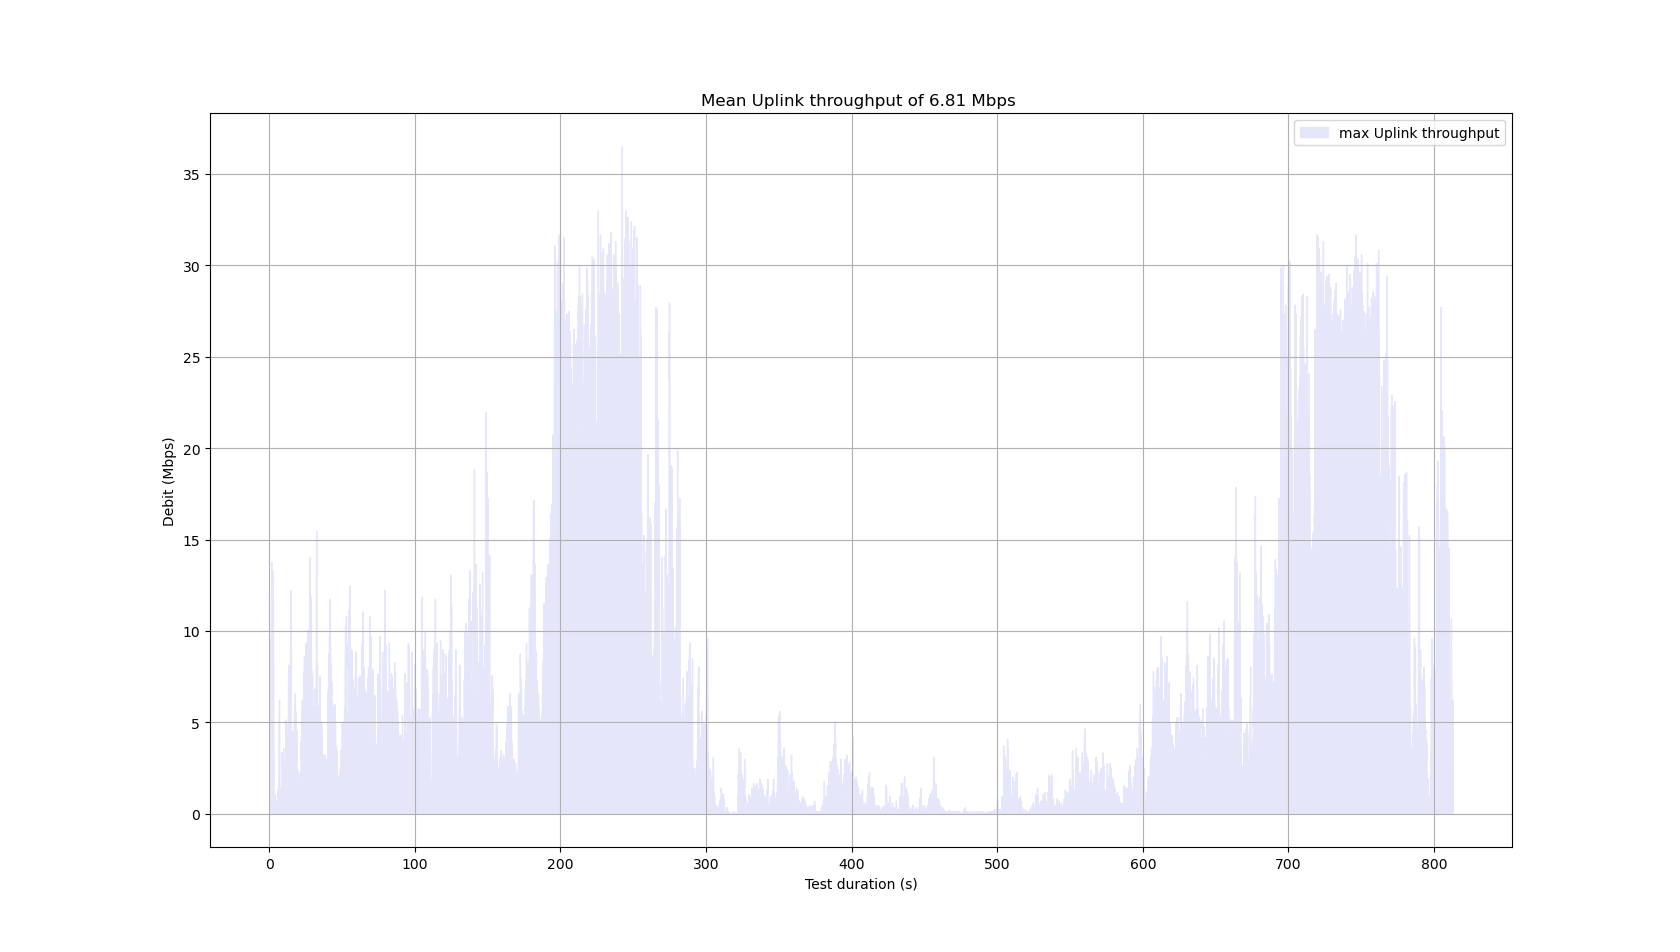
The following pictures present the Cumulative Distribution Function (CDF) of the number of packets that are sent per txops and the CDF of the time between txops, each for uplink and downlink flows. We also add the mean uplink and downlink throughput that were measured during each capture and the txops file name associated.
Trace E
| Downlink throughput | Uplink throughput | Files name |
|---|---|---|
| 219 Mbps | 27 Mbps | orange_trace_E_01_2022_XX.pps (XX in {down; up}) |
Trace D
| Downlink throughput | Uplink throughput | Files name |
|---|---|---|
| 154 Mbps | 16 Mbps | orange_trace_D_01_2022_XX.pps (XX in {down; up}) |
Trace C
| Downlink throughput | Uplink throughput | Files name |
|---|---|---|
| 122 Mbps | 11 Mbps | orange_trace_C_01_2022_XX.pps (XX in {down; up}) |
Trace B
| Downlink throughput | Uplink throughput | Files name |
|---|---|---|
| 84 Mbps | 17 Mbps | orange_trace_B_01_2022_XX.pps (XX in {down; up}) |
Trace_A
| Downlink throughput | Uplink throughput | Files name |
|---|---|---|
| 47 Mbps | 2 Mbps | orange_trace_A_01_2022_XX.pps (XX in {down; up}) |
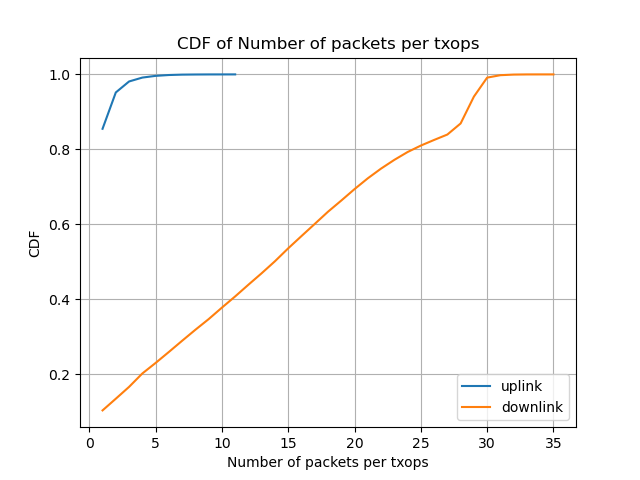
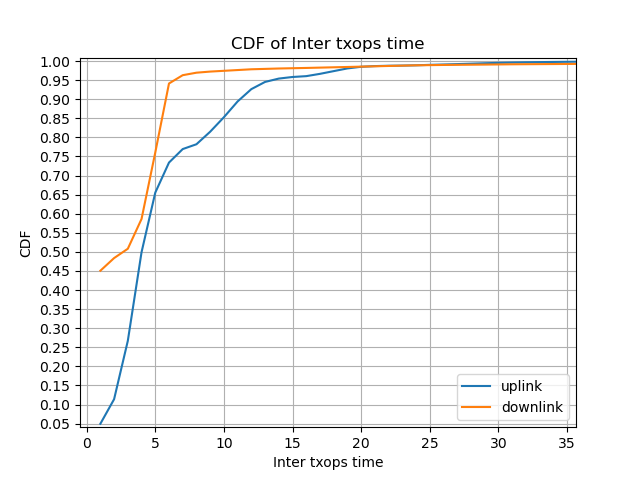
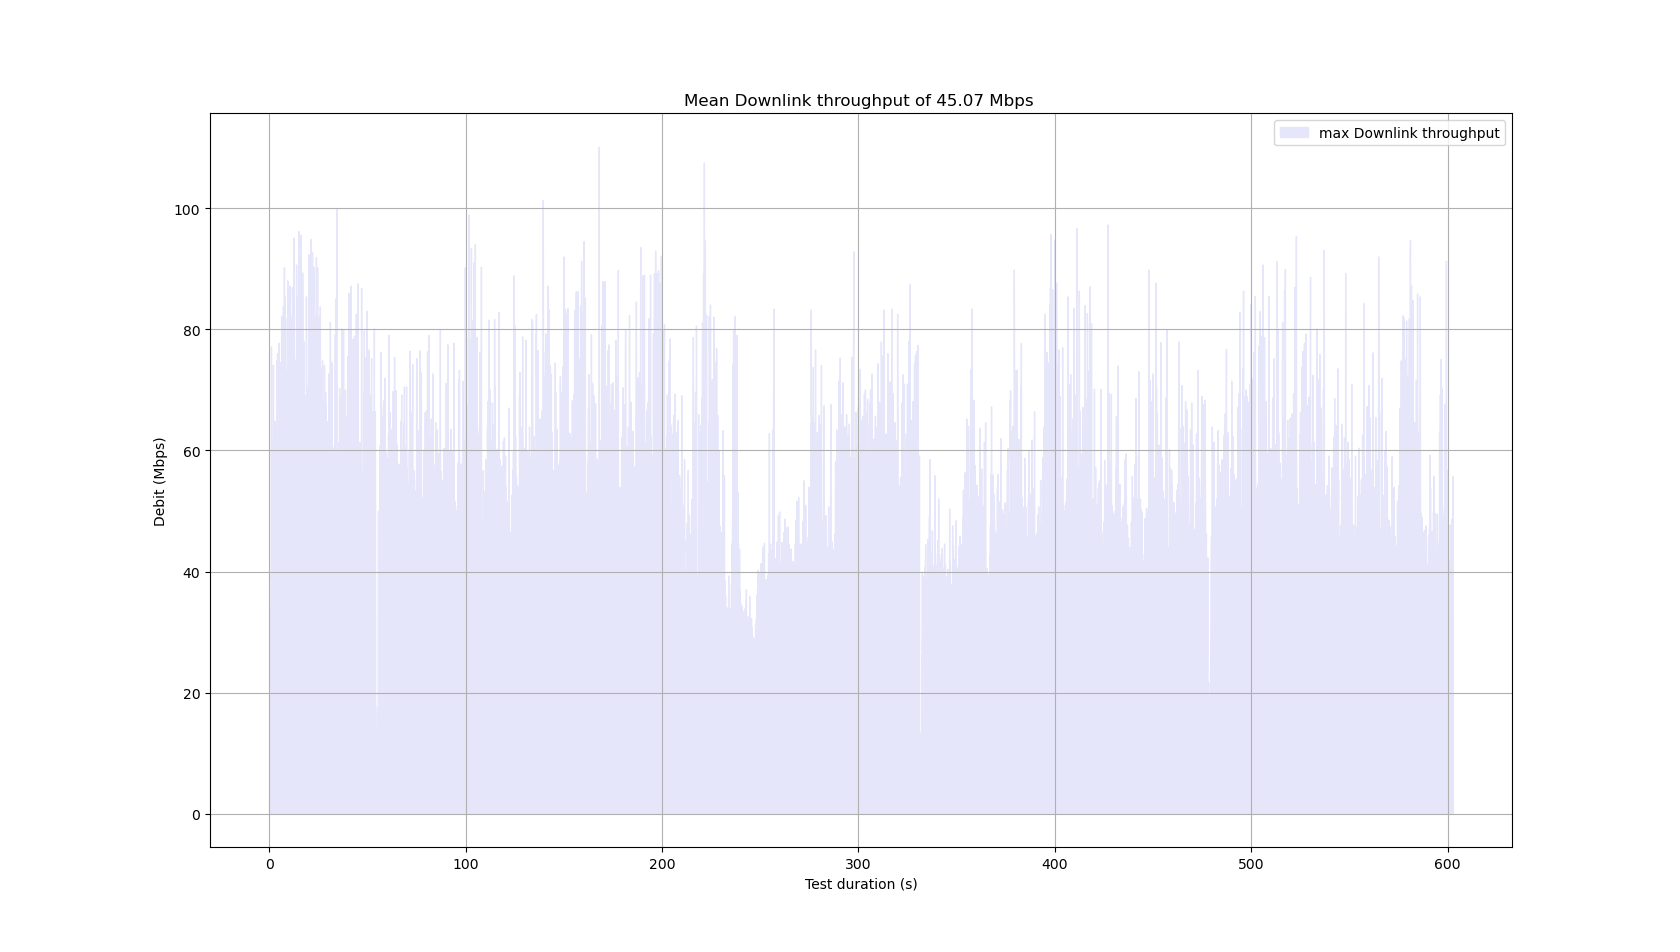
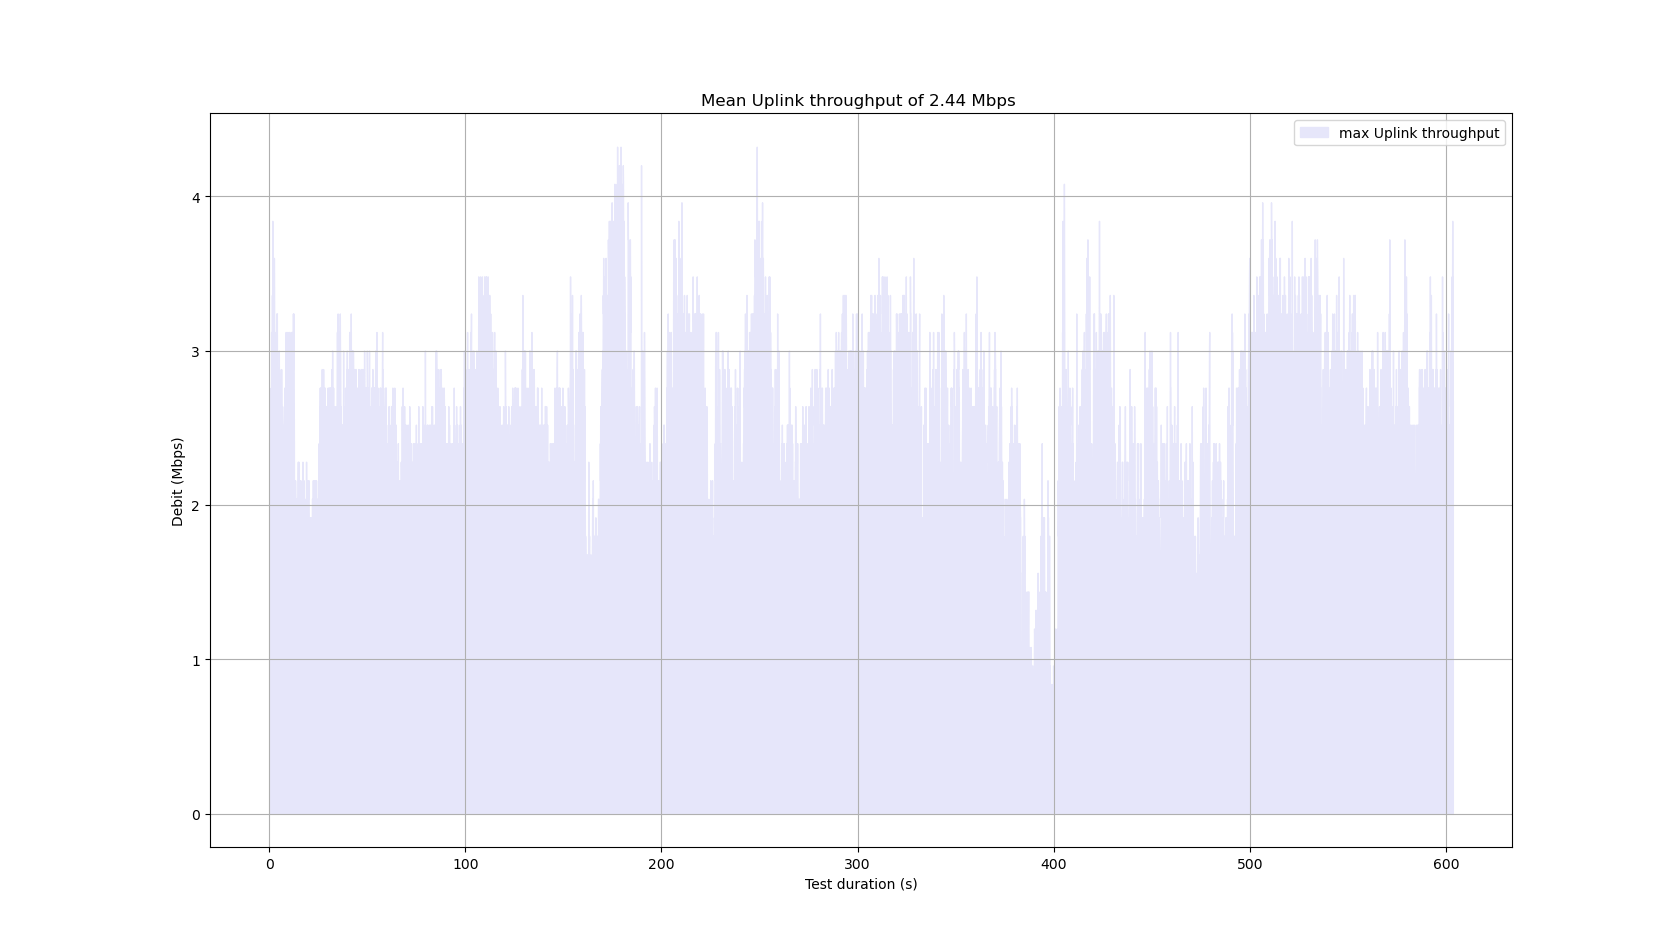
Highway
| Downlink throughput | Uplink throughput | Files name |
|---|---|---|
| 45 Mbps | 6 Mbps | orange_highway_01_2022_XX.pps (XX in {down; up}) |
References
- Netravali, R., Sivaraman, A., Das, S.R., Goyal, A., Winstein, K., Mickens, J.W., & Balakrishnan, H. (2015). Mahimahi: Accurate Record-and-Replay for HTTP. USENIX Annual Technical Conference.
- Winstein, K., Sivaraman, A., & Balakrishnan, H. (2013). Stochastic Forecasts Achieve High Throughput and Low Delay over Cellular Networks. NSDI.
- http://mahimahi.mit.edu/
- https://github.com/keithw/multisend/

